

Top 10 LCPN Cities
Run On Climate has compiled and analyzed the past GHG emissions data of all Local Climate Policy Network (LCPN) member jurisdictions from 2019-2025. That included identifying the 10 LCPN cities and counties that reduced their per capita direct (scope 1) emissions the most from 2022 to 2025 and the 10 LCPN cities and counties with the lowest per capita direct emissions in 2025.
Despite these jurisdictions' performance, much work remains! Only one city appear on both lists: Somerville, MA. Furthermore, only first-placed Tacoma has reduced its emissions in keeping with a science-based trajectory.
Data source: Crosswalk Labs https://www.crosswalk.io/
TOP 10 CITIES IN PER CAPITA DIRECT EMISSIONS REDUCTION: 2022-2025
(Among Run On Climate’s Member Cities)
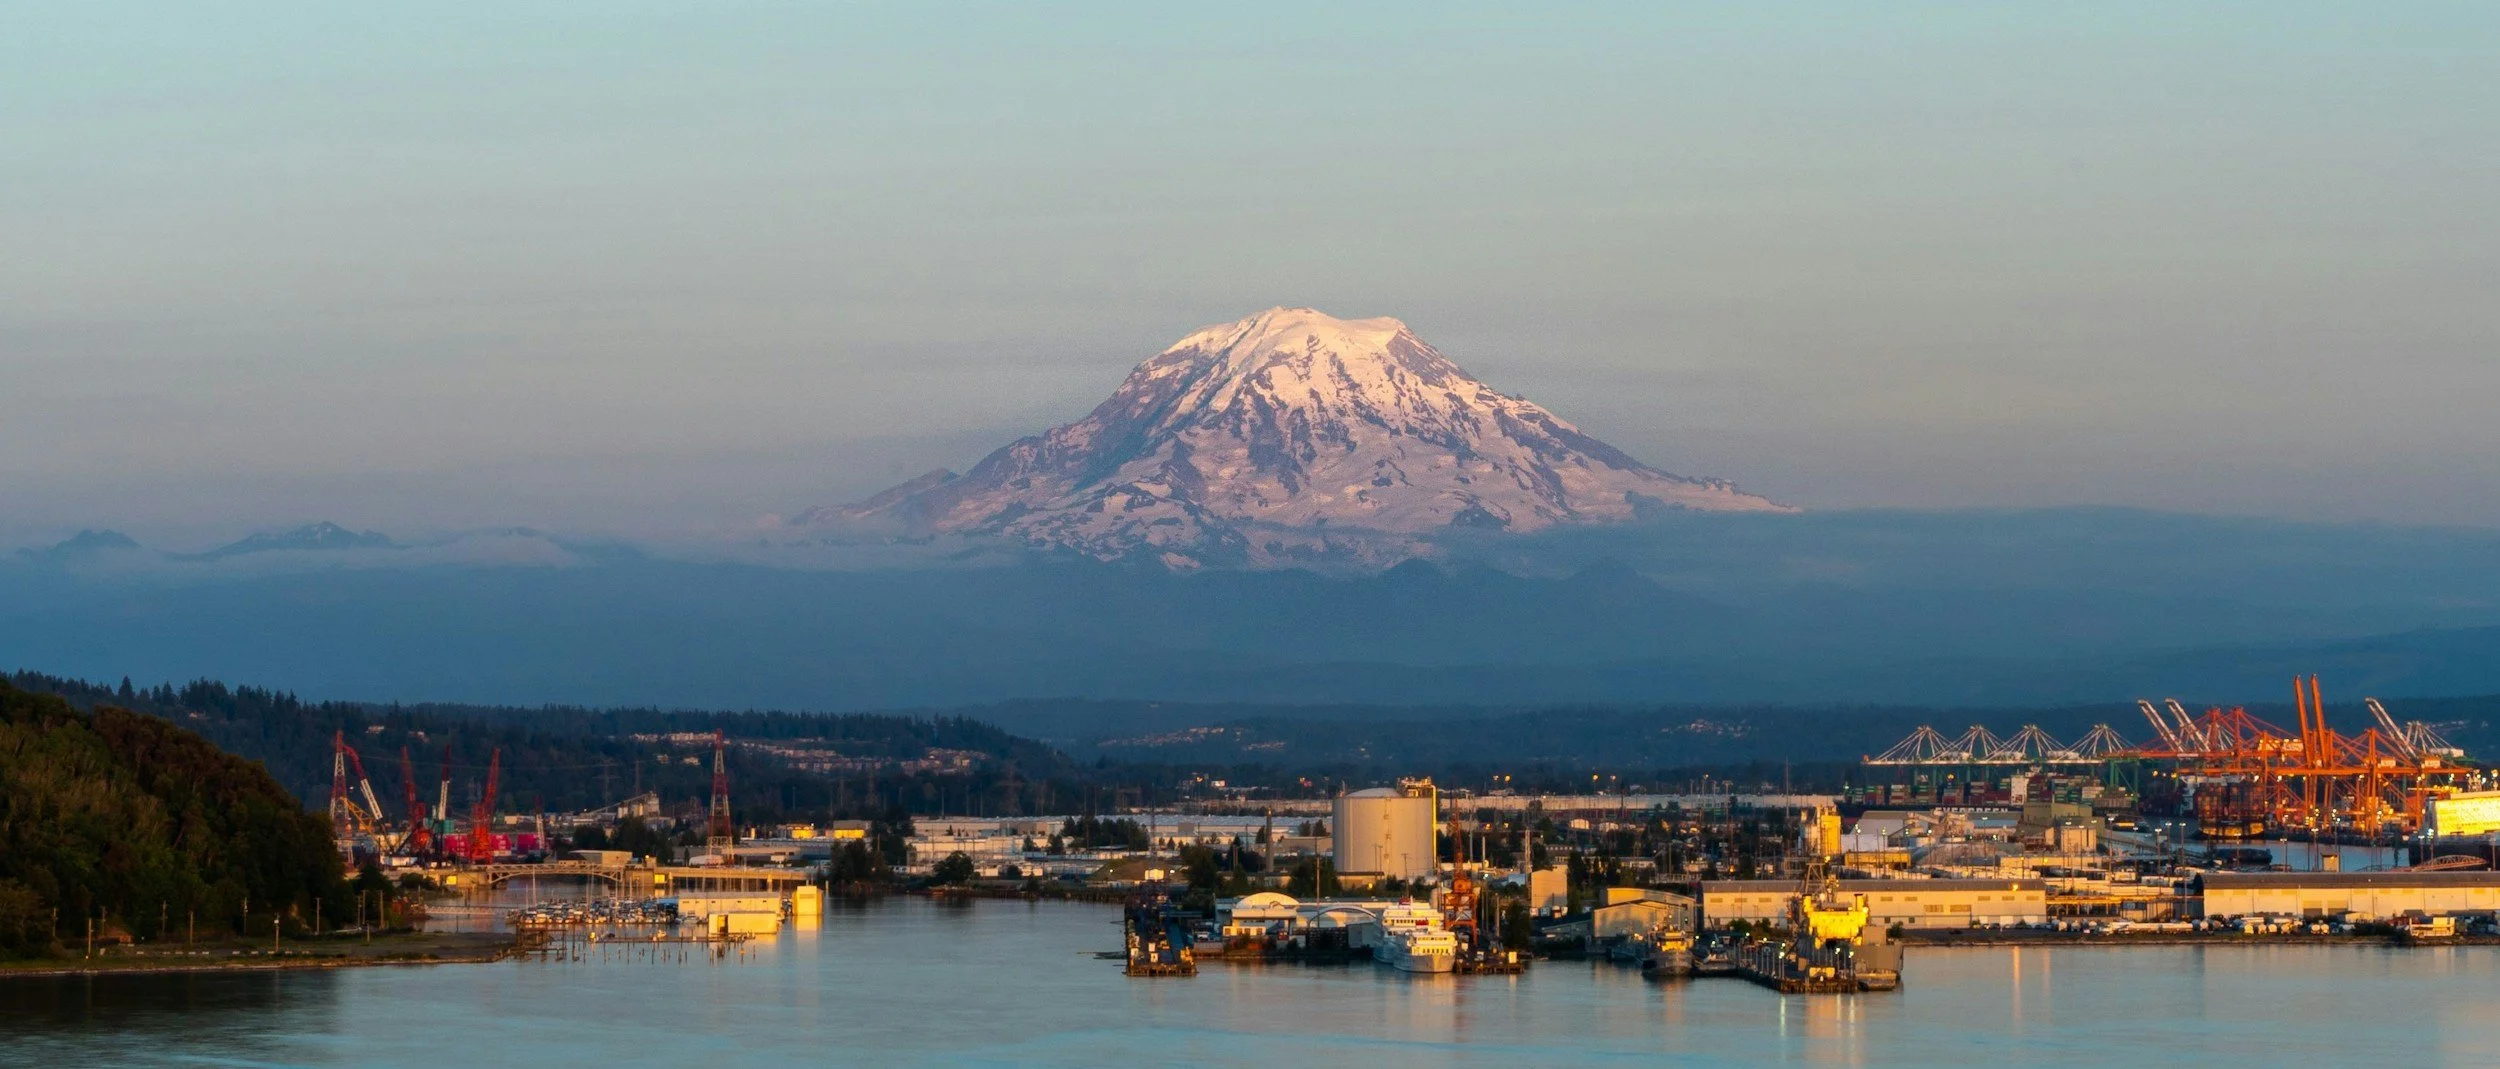
#1 Tacoma, WA
33.64% Reduction
The shutdown of Tacoma's biomass power plant led to a huge drop in the city’s emissions, showing the importance of closing dirty energy production.
#2 Minneapolis, MN
13.17% Reduction
Cleaner electricity generation within the city helped reduce the city’s emissions, showing how a commitment to 100% carbon-free electricity can lower community greenhouse gas emissions.

#3 Ithaca, NY
11.20% Reduction
Electricity-generation emissions declined significantly as the city continued transitioning to cleaner power. By expanding building electrification through Ithaca’s Green New Deal, that cleaner electricity will start to have a larger and larger impact on emissions.

#4 Somerville, MA
7.39% Reduction
Somerville’s Community Choice Electricity program increased the share of renewable electricity available to residents. This lowers electricity-related emissions and will make electric homes and transportation even cleaner!

#5 Burlington, VT
5.88% Reduction
Burlington has reduced fossil fuel use in the transportation sector by expanding the use of electric vehicles, plug-in hybrids, and electric buses while decreasing the number of registered gasoline vehicles, demonstrating the benefits of transportation electrification.

#6 Bloomington, IN
5.00% Reduction
Bloomington's Solar, Energy Efficiency, & Lighting (SEEL) Grant Program helps local businesses and nonprofits install solar panels and improve building efficiency, demonstrating how targeted local incentives can reduce greenhouse gas emissions.

#7 Newton, MA
4.00% Reduction
Newton's Building Emissions Reduction and Disclosure Ordinance (BERDO) requires large buildings to track and reduce their greenhouse gas emissions over time, demonstrating how building performance standards can lower community emissions from one of the city’s largest sectors.

#8 St. Louis Park, MN
3.75% Reduction
St. Louis Park has invested in rooftop solar systems on several municipal buildings, including Fire Stations, demonstrating the city’s commitment to expanding renewable energy and reducing greenhouse gas emissions.

#9 Duluth, MN
3.59% Reduction
The Duluth Transit Authority continued expanding its electric bus fleet, making public transit an even lower-emission transportation option and demonstrating how fleet electrification can help reduce community transportation emissions.

#10 Johnson County, IA
3.31%Reduction
Johnson County partnered with GreenIowa AmeriCorps to provide free home energy audits and energy-saving kits, helping residents reduce energy use and demonstrating how energy efficiency programs can lower greenhouse gas emissions.

TOP 10 CITIES WITH THE LOWEST PER CAPITA DIRECT EMISSIONS: 2025
(Among Run On Climate’s member cities)
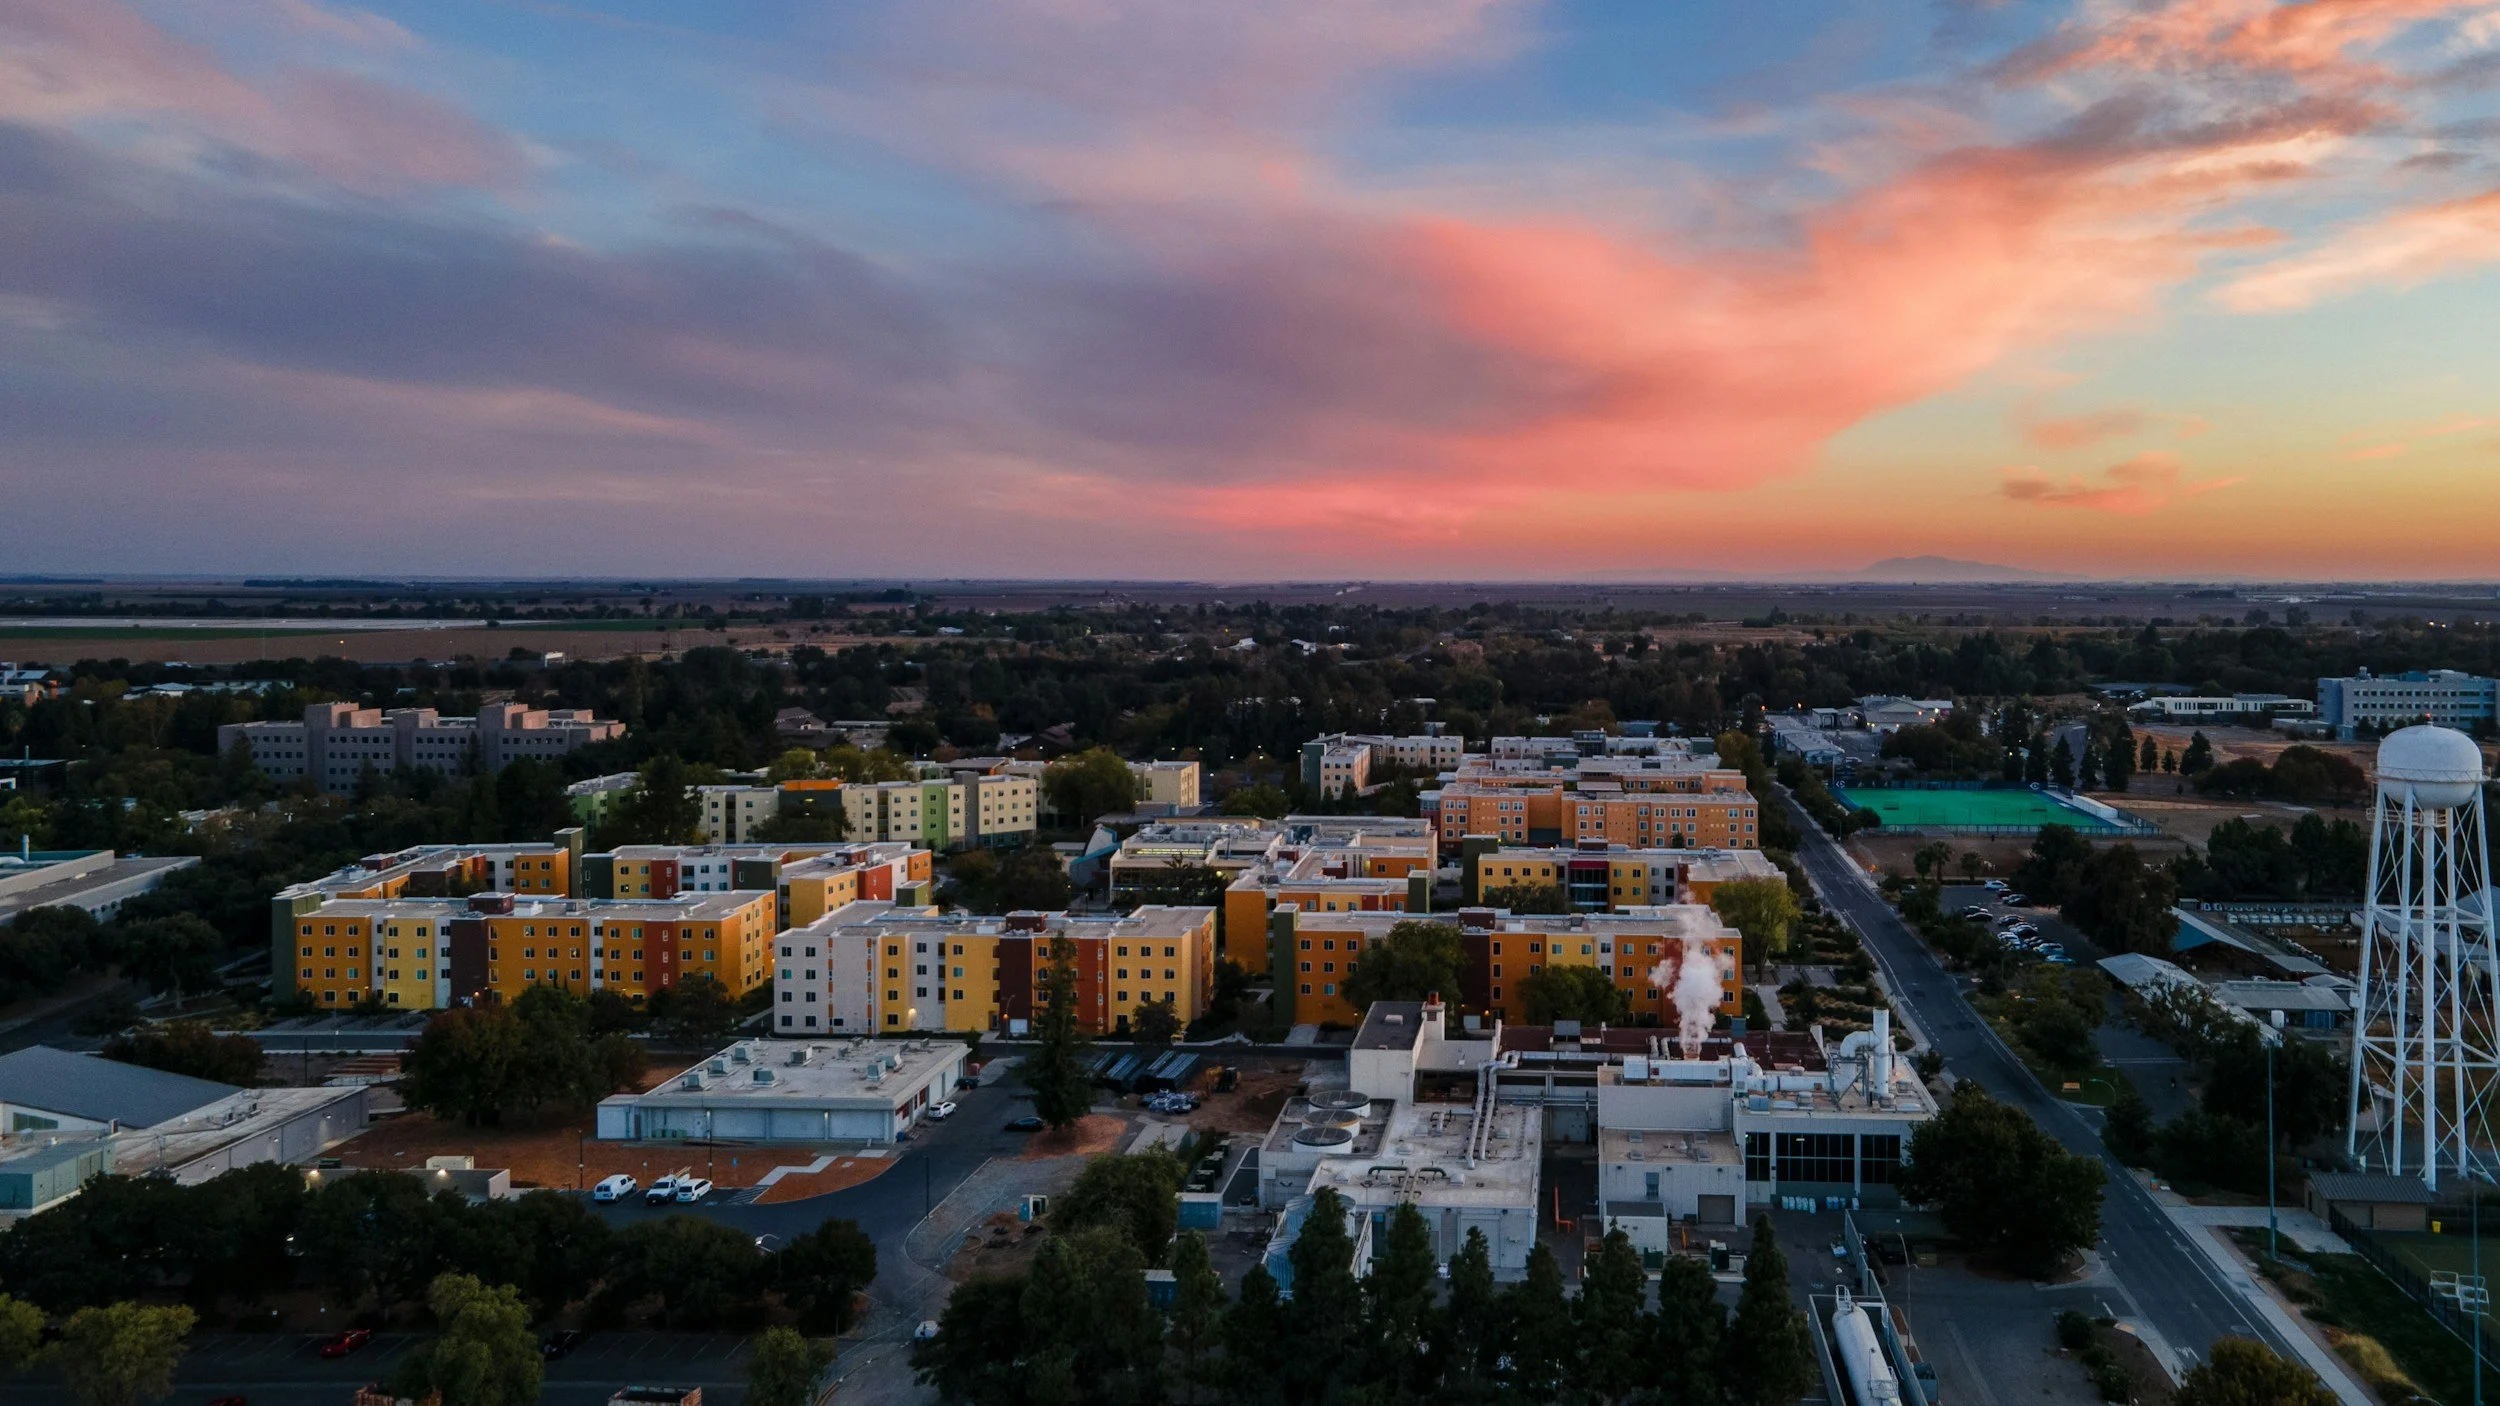
#1 Davis, CA
3.12 tCO₂e
Davis' Bicycle Action Plan and prioritization of protected bike lanes, connected bicycle infrastructure, and bicycle-friendly street design have made Davis one of the three Platinum Bicycle Friendly Cities in the US!
#2 Brookeline, MA
3.27 tCO₂e
Brookline's adoption of the Net Zero Stretch Energy Code requires new buildings to meet higher energy efficiency standards and encourages electrification, which will continue to lower the city’s building emissions.

#3 Somerville, MA
3.51 tCO₂e
Somerville's Climate Forward Plan and Specialized Stretch Energy Code promote highly efficient, all-electric buildings while supporting investments in walking, biking, and public transit to reduce community-wide emissions.

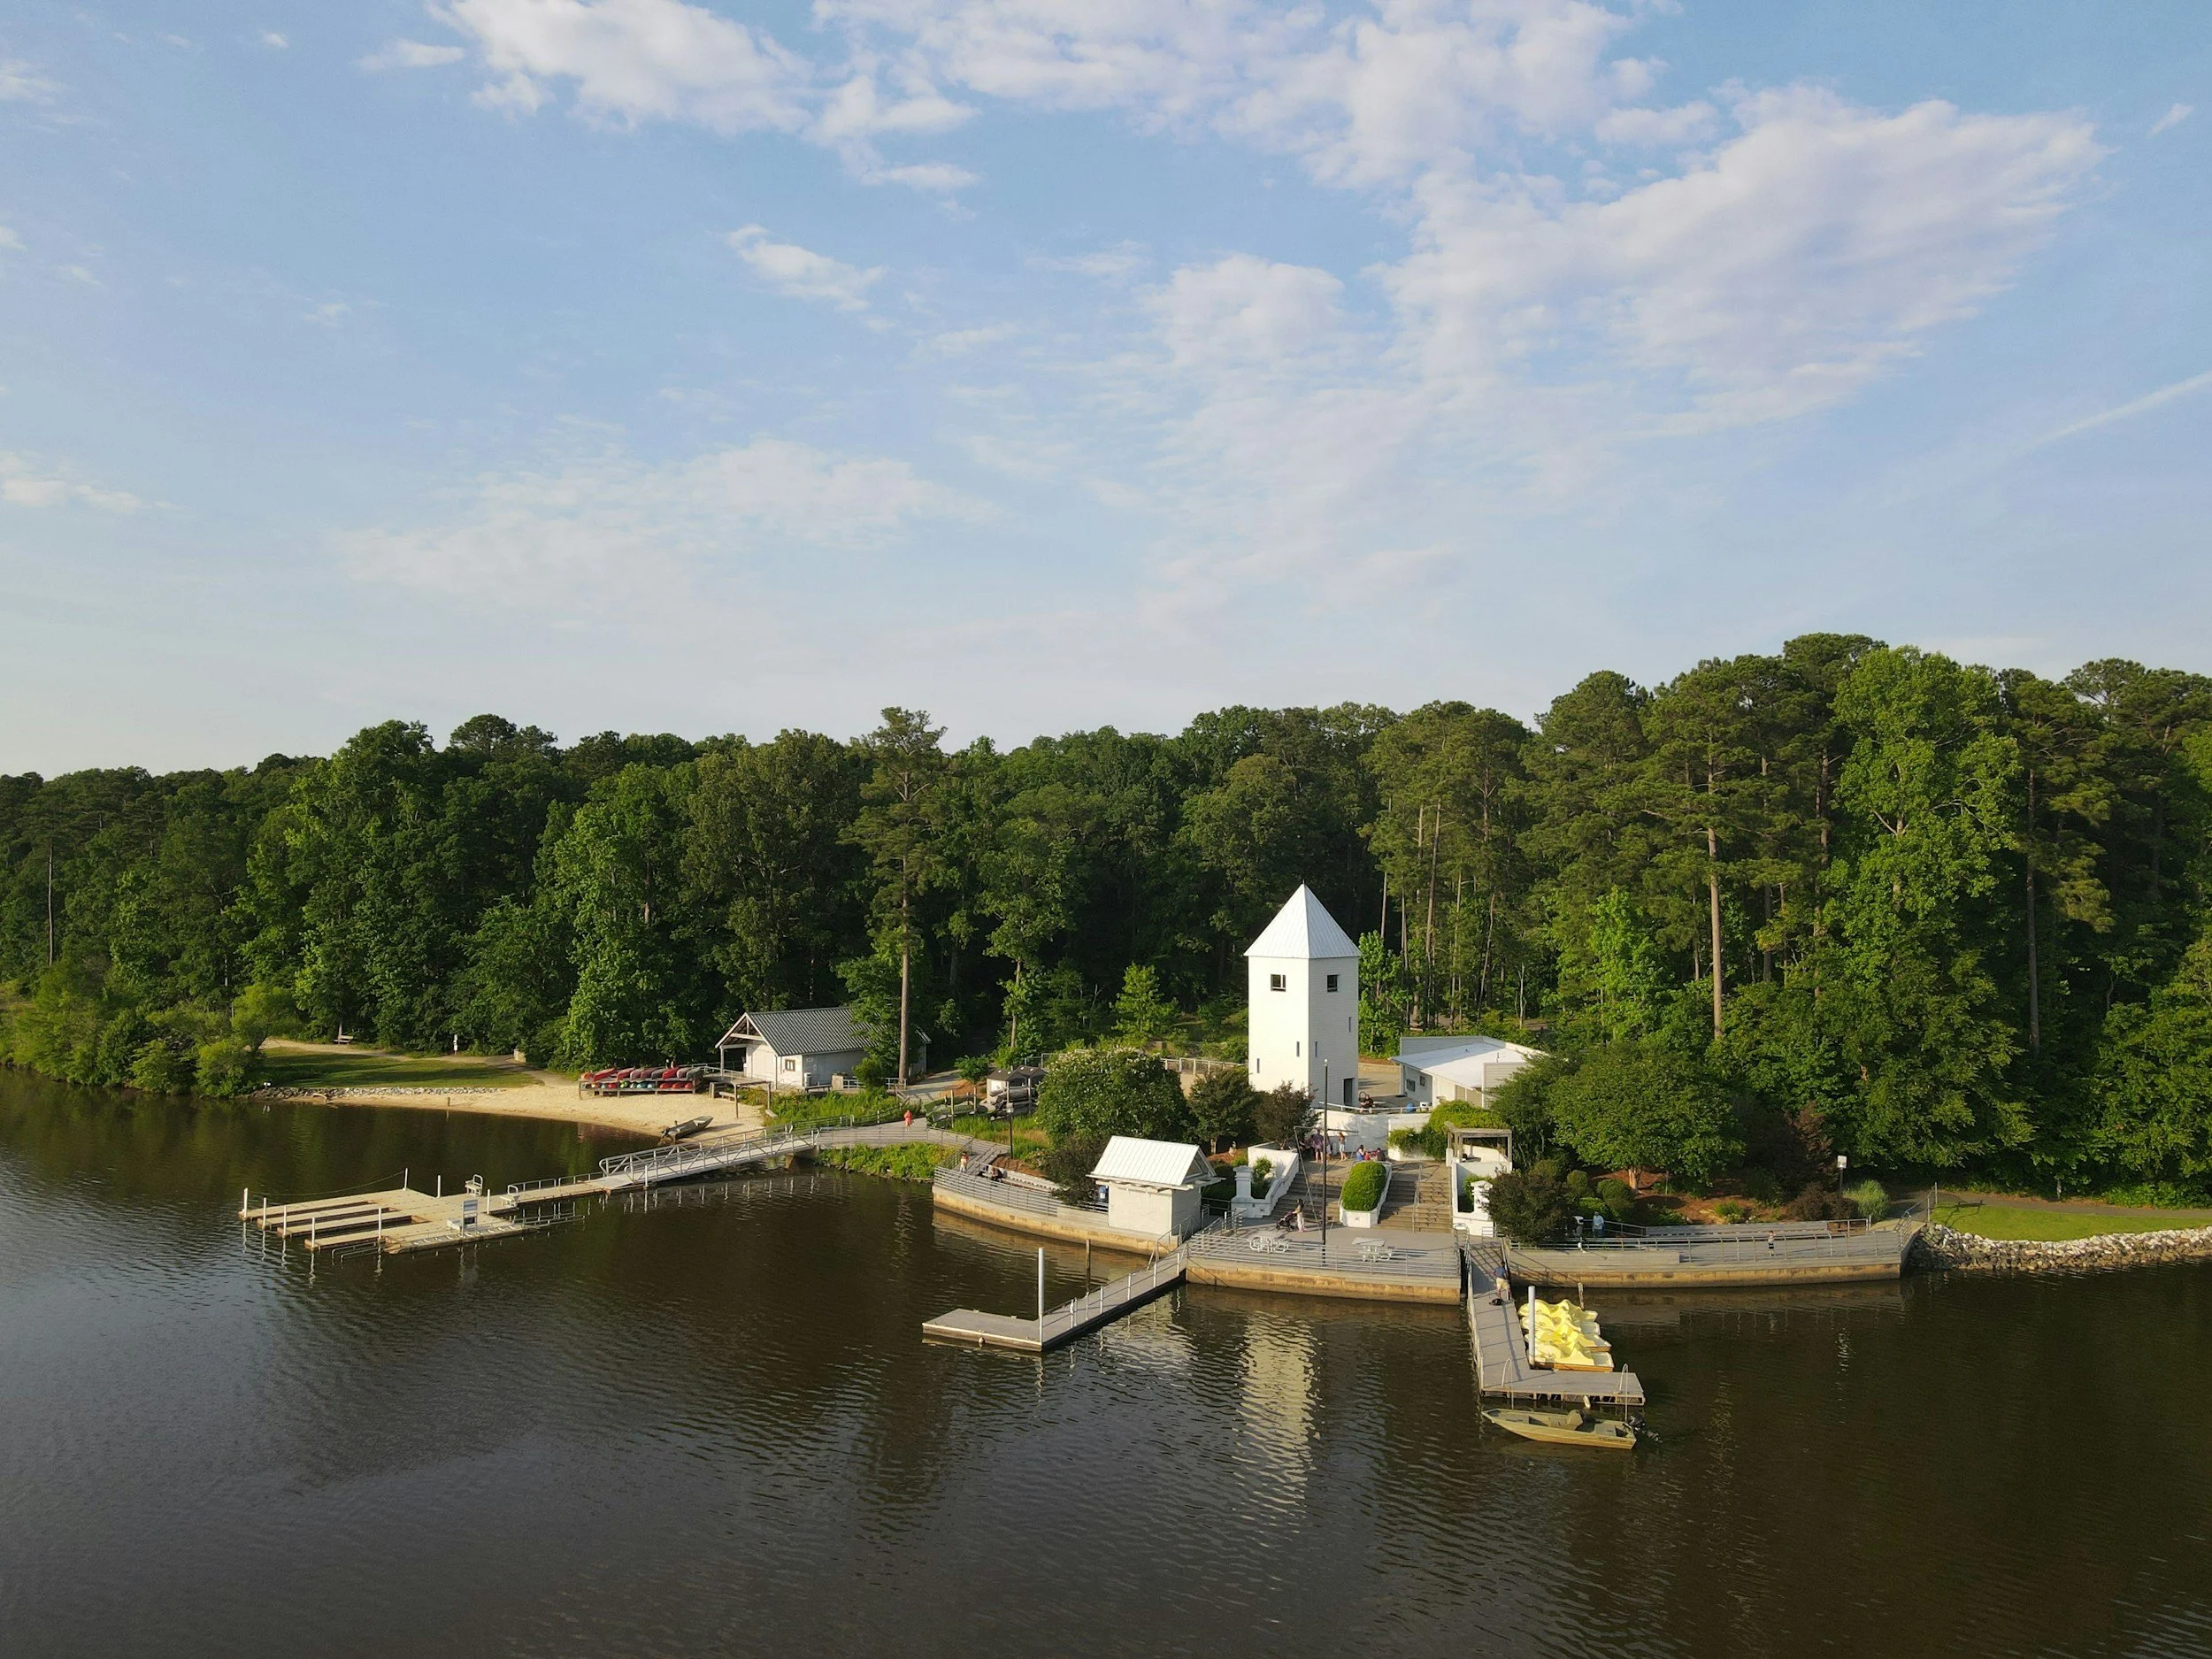
#4 Morrisville, NC
3.95 tCO₂e
Morrisville's Unified Development Ordinance promotes compact, mixed-use development that places housing, jobs, and services closer together, reducing the need for long vehicle trips.
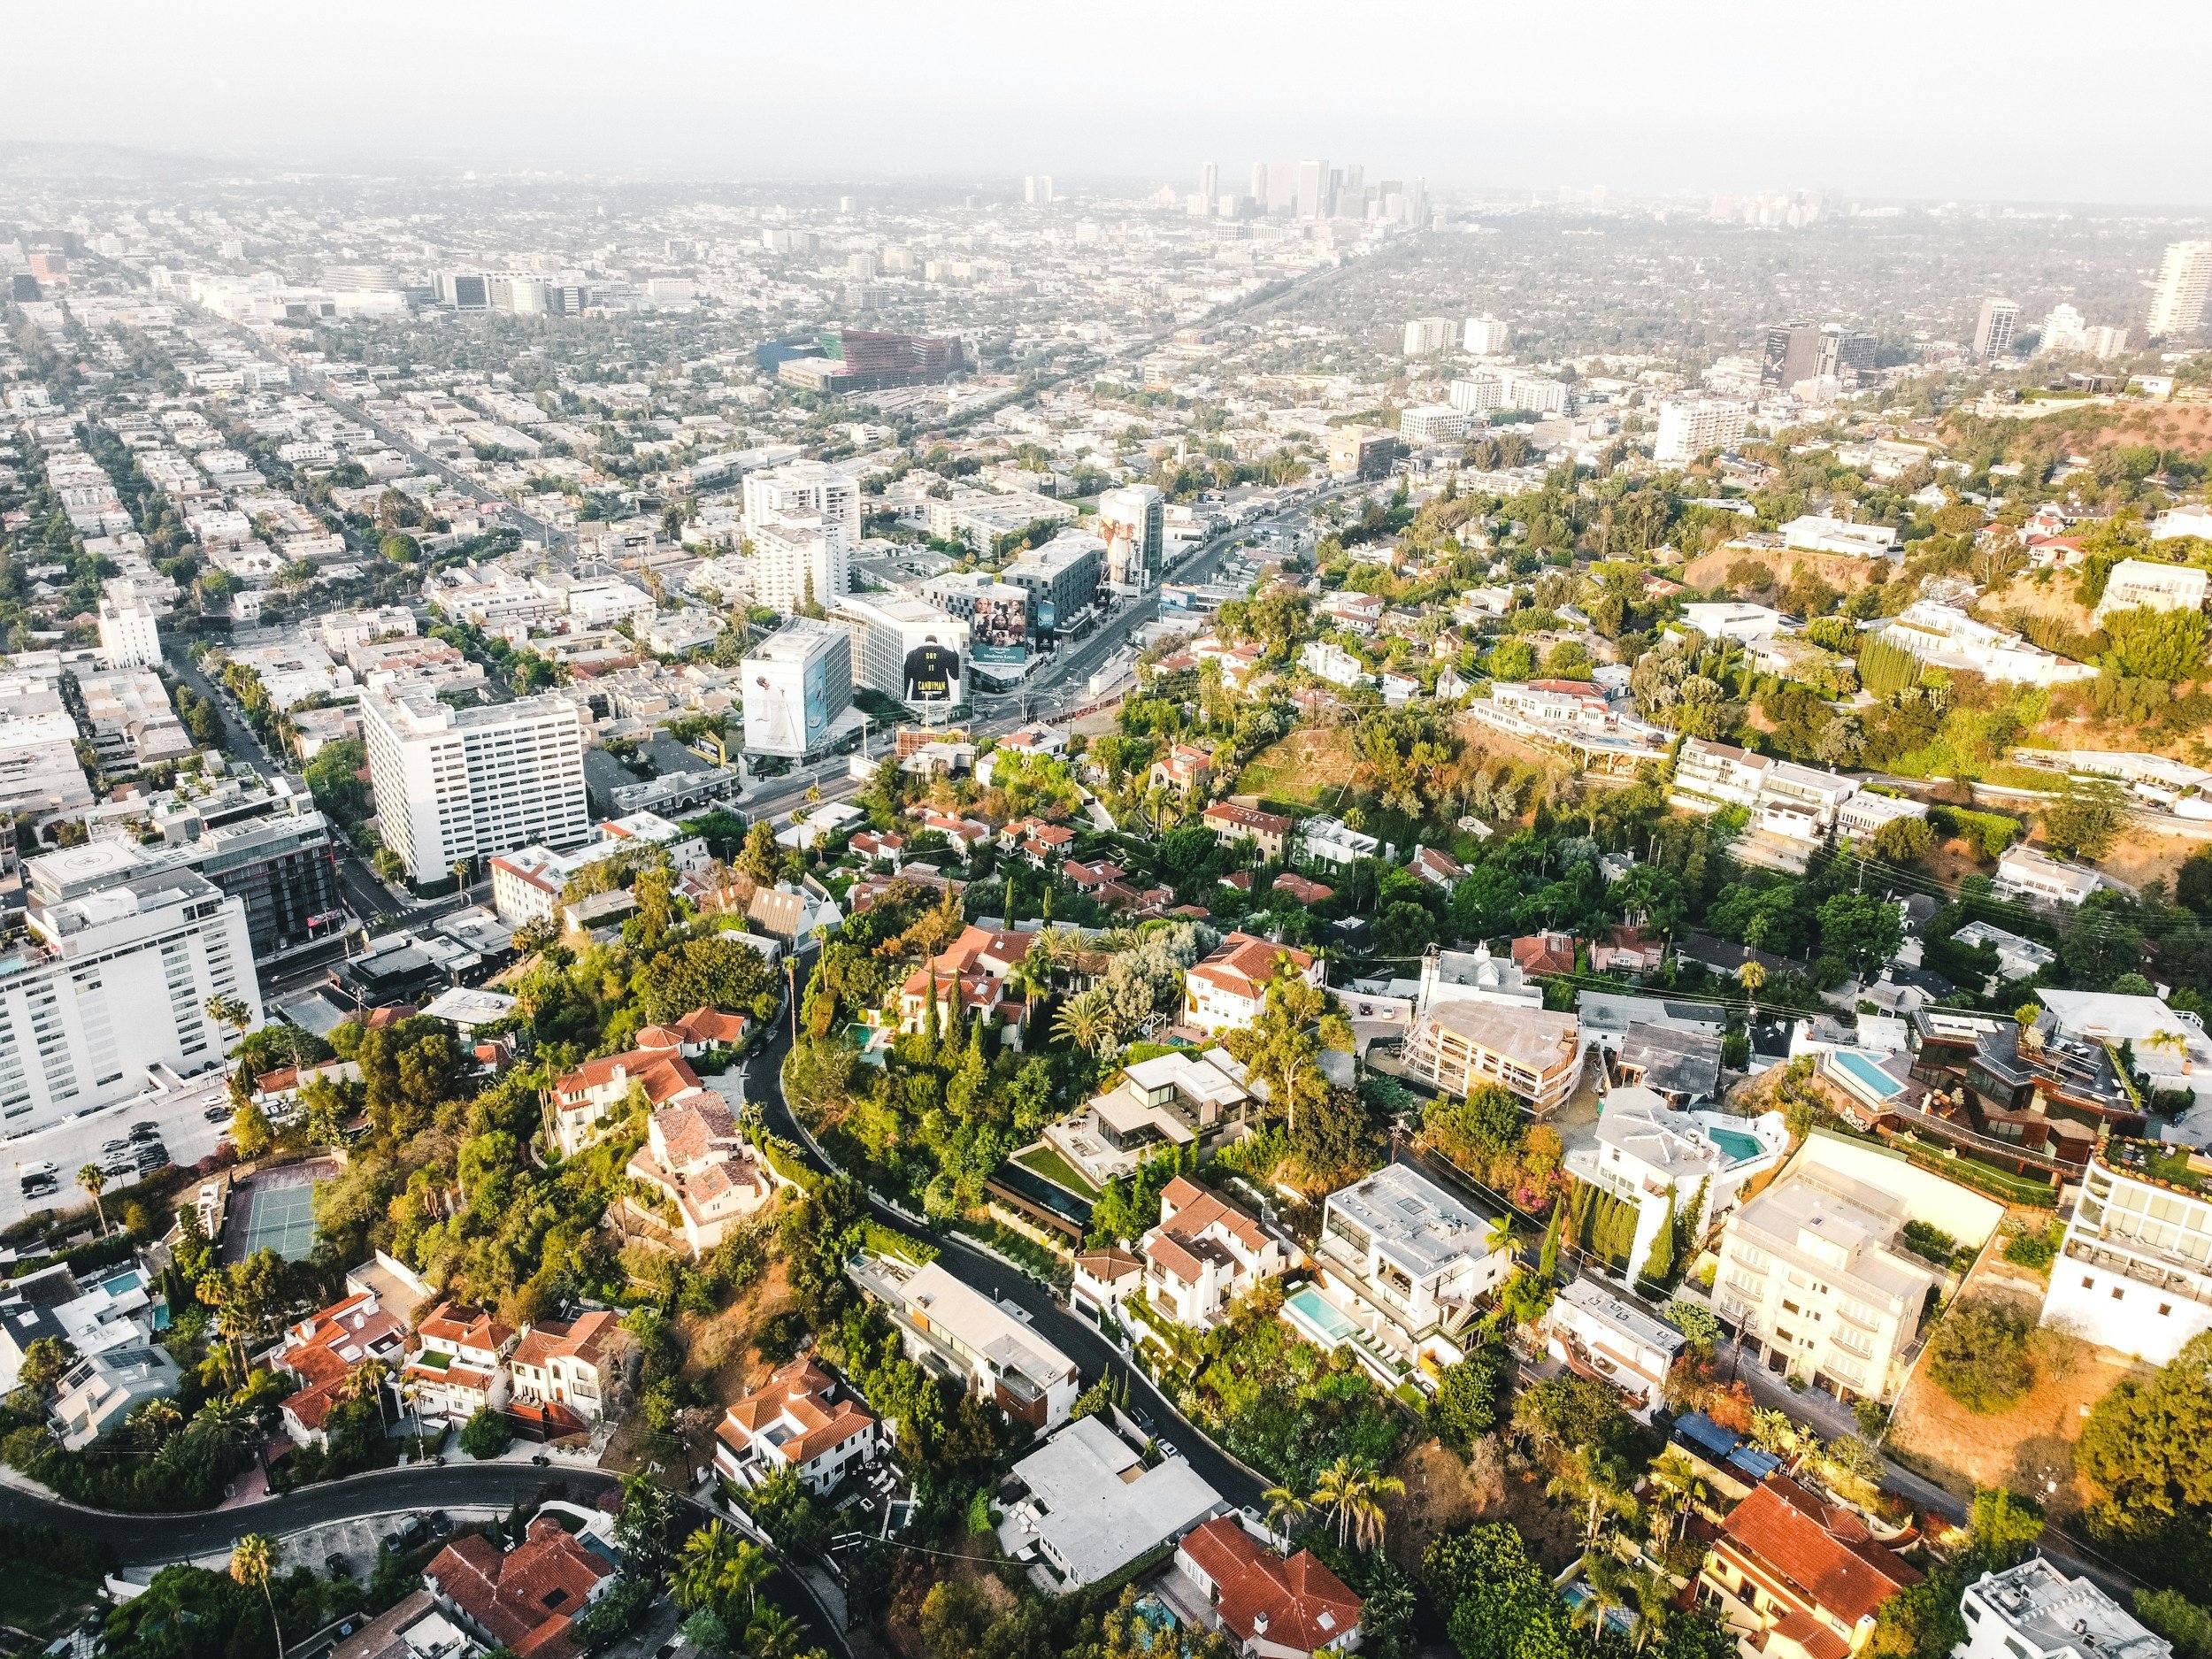
#5 West Hollywood, CA
4.38 tCO₂e
West Hollywood's Equitable Building Performance Standards Ordinance requires large existing buildings to improve energy efficiency and reduce fossil fuel use, lowering emissions from one of the city's largest energy-consuming sectors.
#6 Oak Park, IL
4.81 tCO₂e
Oak Park requires large buildings to report their annual emissions. The city’s next step will be a building performance standard requiring larger buildings to reduce their emissions, complementing the city's existing all-electric new construction law.

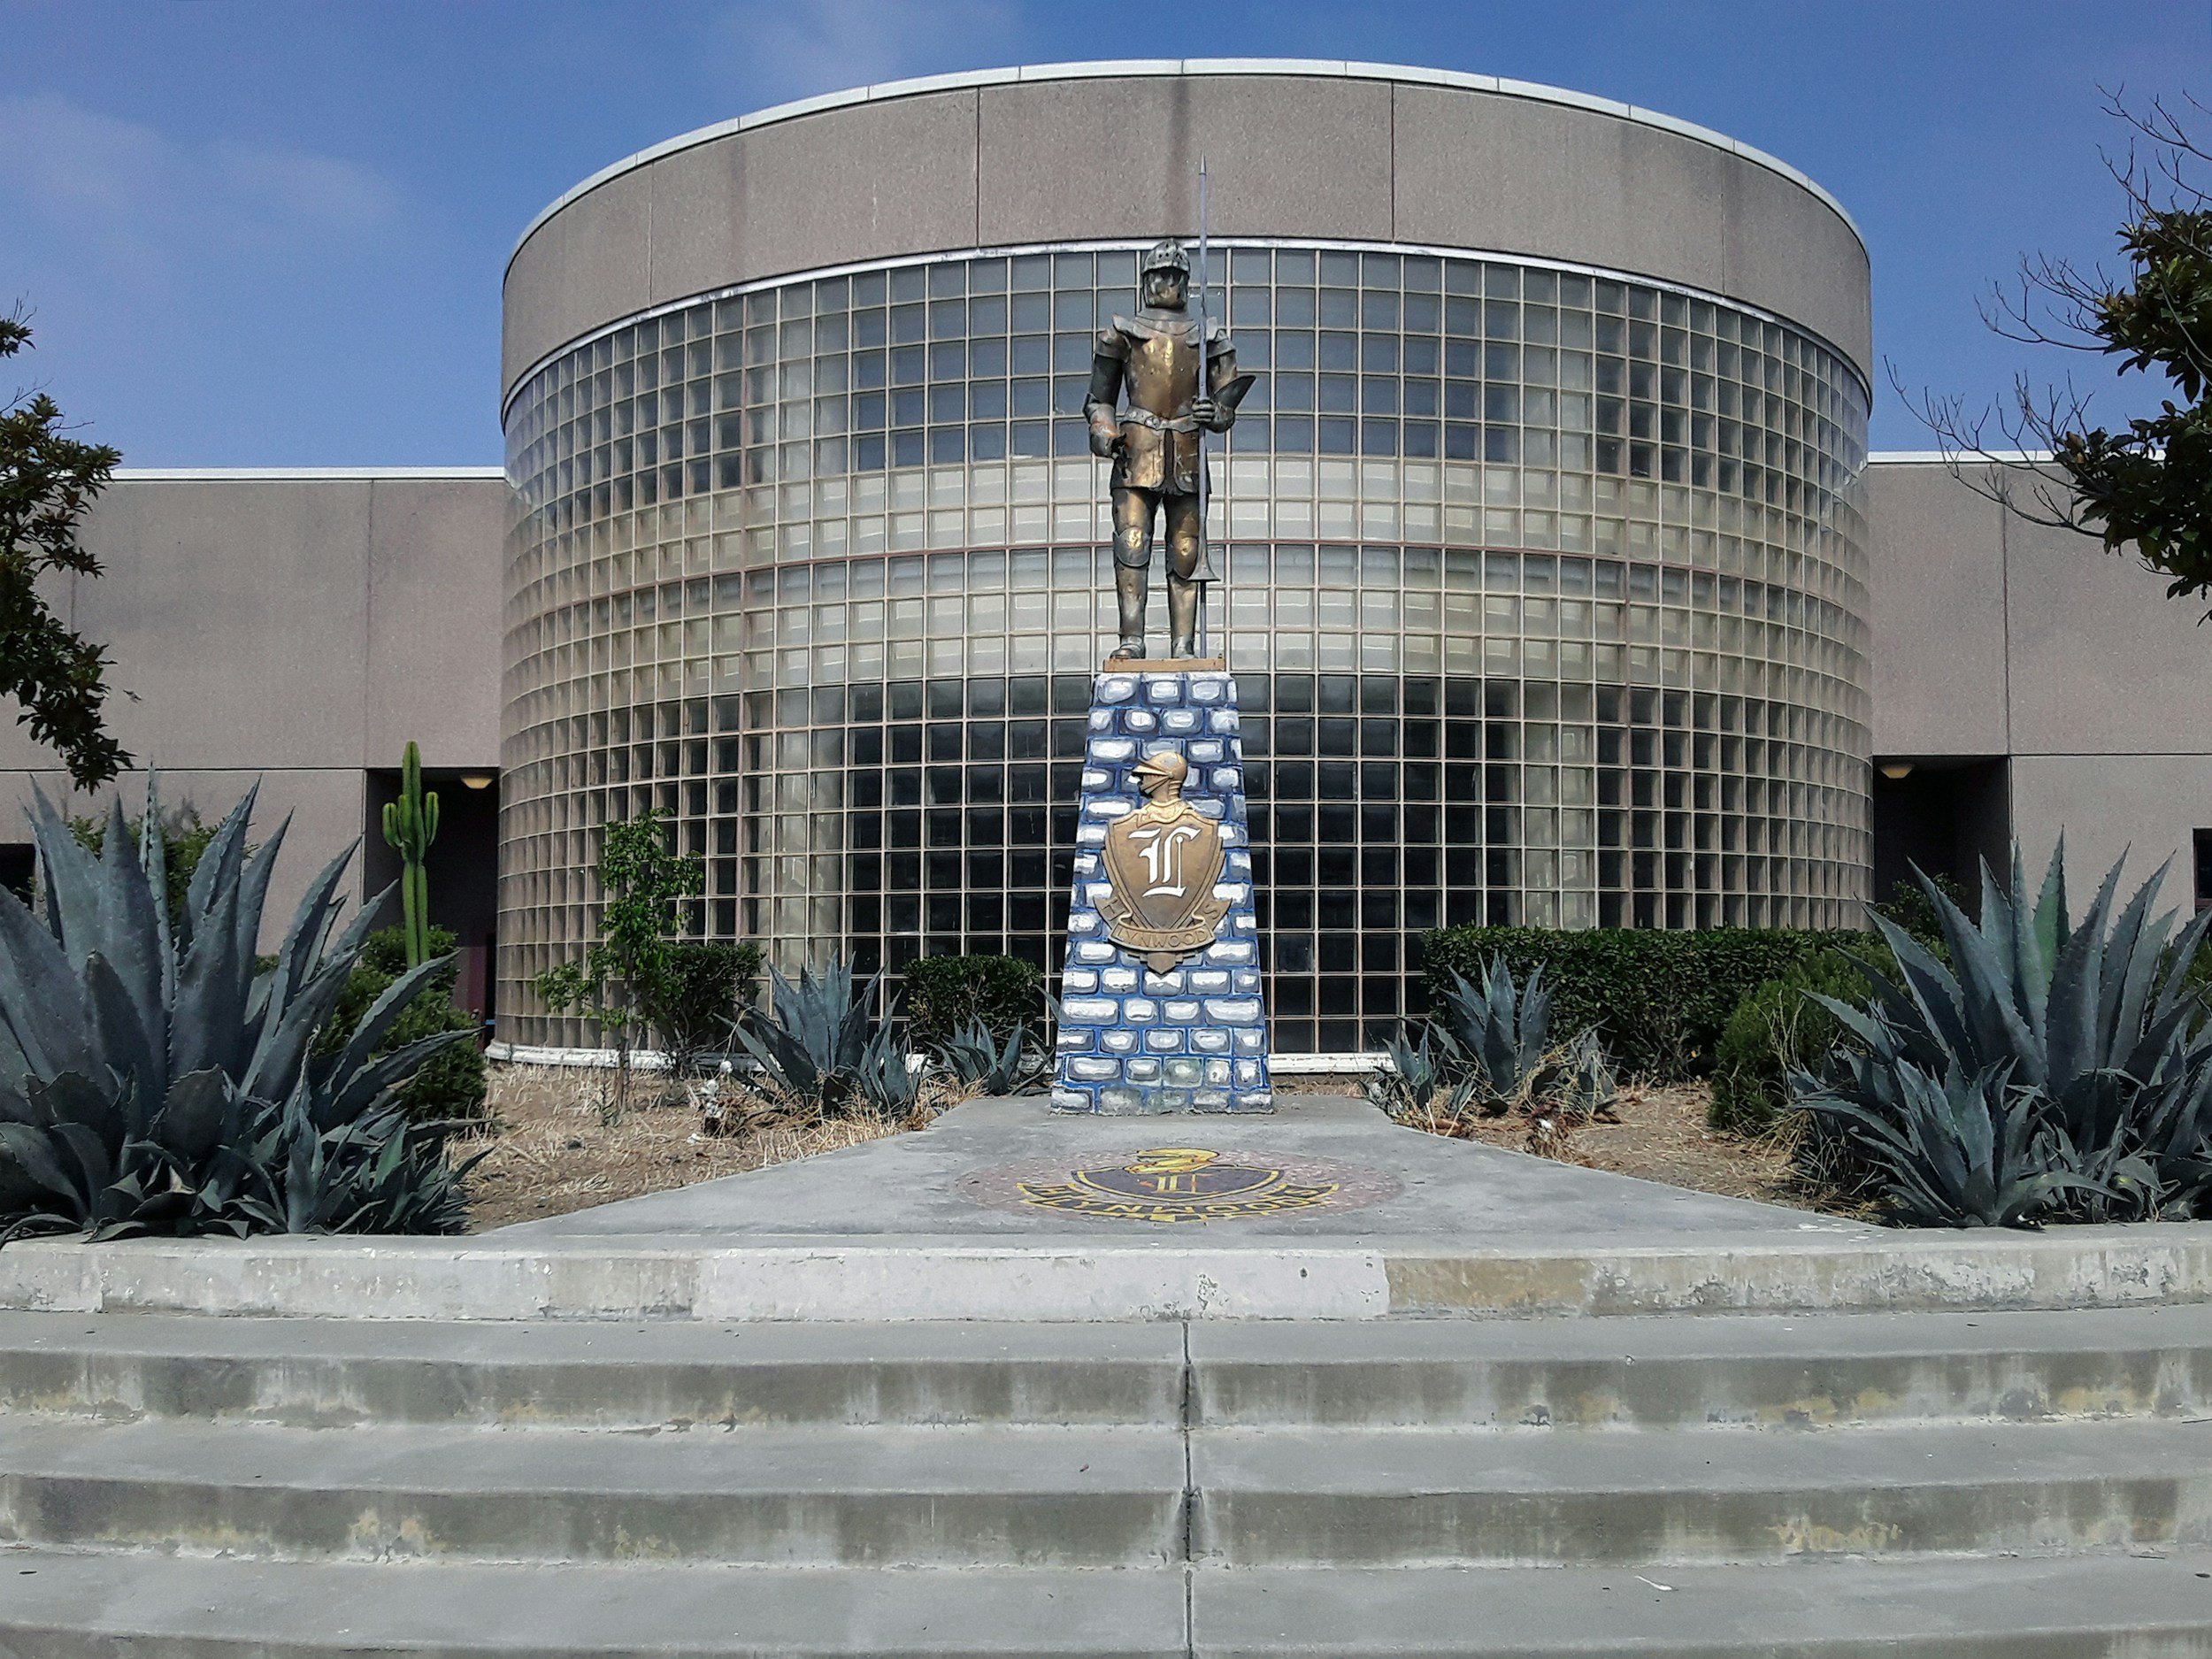
#7 Lynwood, CA
4.94 tCO₂e
Lynwood's Transit-Oriented Development Specific Plan concentrates housing, jobs, and services around Metro stations while requiring pedestrian-friendly street design, reducing residents' need to drive for daily trips.
#8 Evanston, IL
5.00 tCO₂e
Evanston's Healthy Buildings Ordinance requires the city’s largest buildings to reduce their emissions, hitting zero emissions by 2050!

#9 Boulder, CO
5.11 tCO₂e
Boulder's Building Performance Ordinance requires large commercial buildings to report energy use, complete energy assessments, and make lighting and energy efficiency improvements, driving down emissions from existing buildings and saving money.


#10 Oakland, CA
5.58 tCO₂e
Oakland's Zero Emission Vehicle Action Plan expands public EV charging, electrifies city vehicle fleets, boosts e-mobility, and increases access to electric vehicles. The policies will reduce transportation emissions—the city's largest source of greenhouse gas emissions.